Risk done right
What risk actually is.
By Leo HongReviewed 4 min read
Equities (stocks) are high-risk over short periods. Expect large drops at times. That is the price of a higher expected return over the long term, and the chance of a loss shrinks the longer you hold (see the chart below).
Higher expected returns require more risk, but more risk does not guarantee a higher return. Only systematic risk (the market-wide ups and downs everyone shares) is paid with extra expected return. A big holding in one stock adds risk that isn’t paid. This is diversifiable risk (also called specific risk), and you could remove it for free by owning the whole market.
Many beginners think risk just means “markets fall sometimes.” Price volatility (how much prices swing) is only part of the story, and reported volatility can mislead. Illiquid assets, which you can’t sell quickly (direct real estate, private equity), often show smoother reported prices than public stocks, but they can be as risky.
Risk can also hide on the calm side. Money kept in guaranteed investment certificates (GICs) for 30 years feels safe year to year. But after inflation, it can leave you short: it gives up the growth a 30-year goal needs. Younger savers often miss this. Some Canadians only run the numbers in their 50s and find the gap then (the 50s playbook in your 50s to early 60s names it and lists the levers that remain). Planners call it shortfall risk.
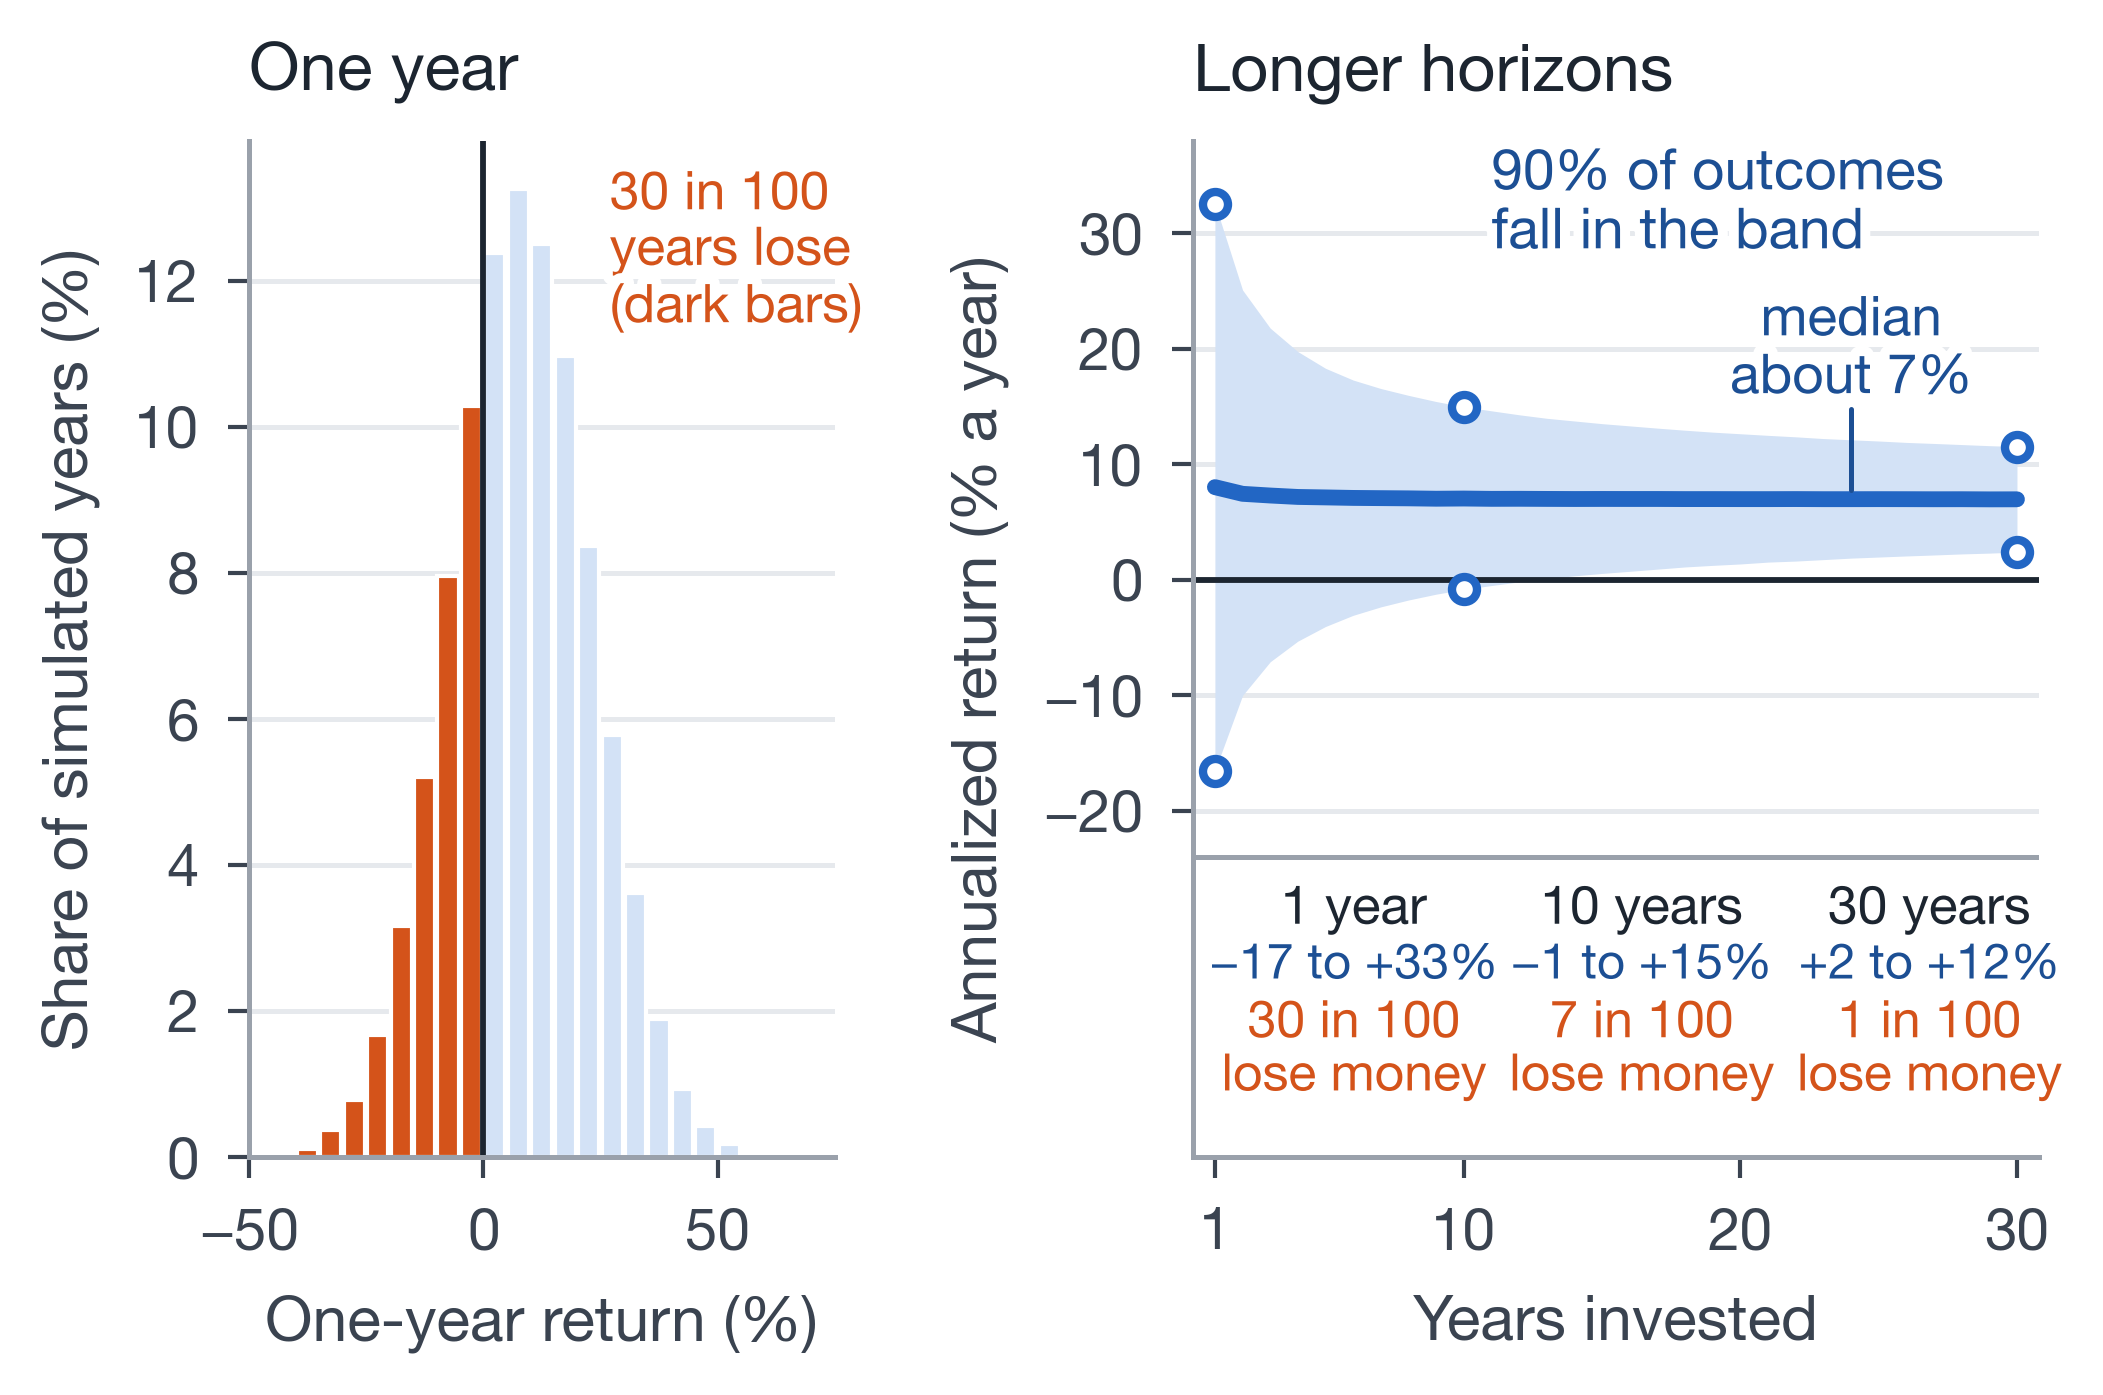
In this simulation, each year’s return averages 8% with a standard deviation of 15% (a measure of how widely yearly returns scatter around the average; too sure explains it). About 30 single years in 100 lose money. Only about 7 ten-year stretches in 100 lose money, and about 1 thirty-year stretch in 100. The band holding 90% of outcomes narrows with time: from about −17% to +33% a year over one year, to about +2% to +12% a year over thirty. The median line (the middle result: half the paths did better, half worse) sits near 7%, a little below the 8% average, because gains and losses compound unevenly. It is a model with assumptions I chose, not a promise. Real markets have deeper and longer bad stretches, and a narrower range does not mean no risk. The rates in the Foundations articles (5%, 6%, and this chart’s 8% average) are teaching numbers, not forecasts. For planning, basics in plain language uses ~6–7% a year for global stocks before fees.
Ask a new investor about risk tolerance and they say “high.” A 20% drop often tells a different story: panic selling. Most new investors have never lived through a long bear market (a deep, lasting fall). Until one arrives, their true tolerance is unknown, even to themselves.
Planners use a steadier frame: your risk profile, meaning how much risk you can take. It sets the most stock you should hold in your asset allocation (your mix of stocks and bonds) and has two parts:
1. Risk capacity — what your finances can withstand: A stable job, no large spending in the next 5 years, an emergency fund, and decades to retirement mean higher capacity. Variable work, or money needed for a down payment next year, means lower capacity, even if you feel brave.
2. Risk tolerance — how you act when markets fall: Some people shrug. Some can’t sleep. Both are real. Tolerance is behaviour: crashes reveal it, questionnaires don’t.
One rule keeps them honest: never take more risk than your risk profile allows, meaning the lower of capacity and tolerance. That ceiling caps your stock share, whatever your goals (see lifecycle and human capital) seem to ask for.
Tolerance can be trained. Learn how deep past drops were and how long recoveries took. Use a risk questionnaire (simple portfolios links two) as a starting estimate, and choose a mix at or below your risk profile’s ceiling.
Reassess as you gain experience. Write your plan for a drop ahead of time in your IPS (your one-page investing rule sheet). After you live through a crash, use the lesson at your next review. Raise risk only after you have proven you can stay invested.
Takeaway on diversification: you are paid to hold market-wide risk, not the risk of a single company, sector, or country. Owning the whole global market keeps the paid part and removes the rest.
Plain-language takeaways:
- Don’t ask only “What’s my tolerance?” Stay at or below your risk profile’s ceiling: the lower of capacity and tolerance.
- Match money to horizon. Under 5 years, use a high-interest savings account (HISA) or GICs that mature when you need the money, and no stocks. Bond funds, even short-term ones, can still lose value, so use them only for a part you could see dip. Basics in plain language covers medium and long horizons.
- Diversify globally by default. Canada is home. It is not the world. Details in Investing.
With your risk profile defined, lifecycle and human capital adds your financial goals and shows why age and job stability shape how much equity you can carry.